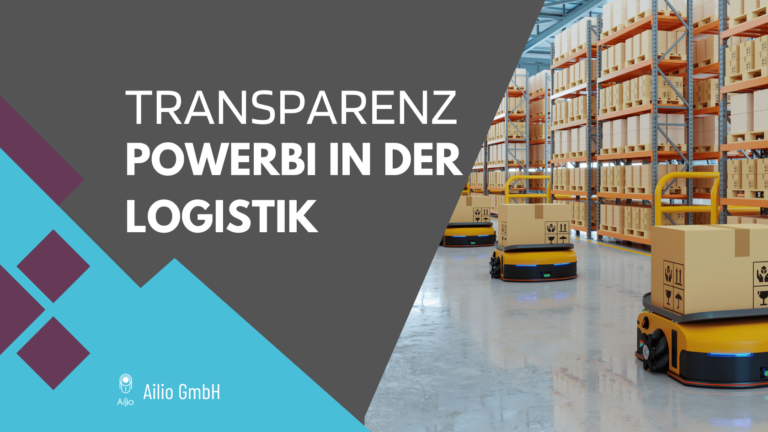
The logistics industry is the beating heart of the global economy. But it is also complex, fast-moving and generates vast amounts of data: shipment status, route optimization, stock levels, vehicle telemetry, delivery times, transport costs – the list is endless. For many companies, trying to keep track of all this is like poking around in the fog. A lack of transparency leads to inefficiencies, unnecessary costs and missed opportunities.
How can you bring light into the darkness and really understand and control your logistics processes? The answer lies in the intelligent use of data through Business Intelligence (BI) dashboards. In this article, we show how a customized BI dashboard for logistics creates much-needed transparency and serves as a Power BI use case to enable informed decision-making.
The challenge: the cost of opacity
Typical problems arise when data is isolated in different systems (TMS, WMS, ERP, Excel spreadsheets) and can only be compiled manually with great effort:
- Delayed information: Decisions are based on outdated data.
- Lack of an overall view: It is difficult to recognize how different areas (transport, warehouse, distribution) interact or where bottlenecks really lie.
- Difficult performance evaluation: The performance of routes, vehicles or carriers is difficult to measure and compare objectively.
- Reactive instead of proactive action: Problems are often only noticed once they have already occurred (e.g. a late delivery).
- Inefficient use of resources: empty runs, suboptimal routes or underutilized storage capacities remain undetected.
The solution: The logistics BI dashboard as a central cockpit
A BI dashboard is much more than just a collection of colorful graphics. It is an interactive, visual control center that consolidates data from various sources and displays the most important key performance indicators (KPIs) at a glance. For logistics, this means
- A single source of truth: all relevant data in one place, consistent and up-to-date.
- Visualization of trends and patterns: diagrams, maps and charts make complex relationships understandable.
- Real-time or near-real-time insights: See what’s happening right now, not at the end of the month.
- Interactive analysis: Causes can be researched and details examined using filters and drill-down functions.
Concrete insights through a logistics dashboard (Power BI application example)
Imagine a dashboard created with Power BI that is specifically tailored to your logistics needs. What transparency could you gain?
- Consignment tracking & punctuality (OTIF):
- What you see: A live map with the location of your vehicles/shipments (via telematics data integration), KPI tiles for the On-Time-In-Full (OTIF) delivery rate, charts on average delays by region or carrier.
- Transparency: immediate overview of the delivery status, quick identification of problem areas or unreliable partners. Proactive customer communication in the event of foreseeable delays.
- Transportation cost analysis:
- What you see: Charts on costs per kilometer, per shipment or per customer. Comparisons of the costs of different carriers. Trend analyses for fuel costs or ancillary costs (tolls, demurrage).
- Transparency: a clear view of the cost drivers. Basis for better negotiations with freight forwarders and for identifying potential savings on routes or means of transportation.
- Warehouse & inventory management:
- What you see: Graphics on current stock utilization, key figures such as stock turnover rate, picking accuracy, ABC analysis of stock items, warnings for low stocks or “slow sellers”.
- Transparency: Optimized warehousing, reduction of tied-up capital, avoidance of stock shortages and improved picking performance.
- Fleet management:
- What you see: Dashboards for vehicle utilization, overview of maintenance intervals and status, analyses of fuel efficiency per vehicle or driver, integration of driver behavior data if necessary.
- Transparency: maximum fleet utilization, minimized downtimes thanks to predictive maintenance, identification of potential fuel savings.
- Freight forwarder performance:
- What you see: A scorecard that evaluates and compares your service providers based on KPIs such as punctuality, costs, damage rate and communication quality.
- Transparency: an objective basis for selecting and managing your logistics partners.
The advantages: From transparency to tangible results
This newly gained transparency through a BI Dashboard Logistics is not an end in itself. It leads directly to measurable improvements:
- Faster, more informed decisions: Act on the basis of current facts.
- Increased efficiency: Optimize processes along the entire supply chain.
- Significant cost reduction: Uncover hidden costs and make better use of resources.
- Improved customer service: Increase delivery reliability and communication skills.
- Measurable performance: Set and track clear goals for teams and partners.
Power BI as the tool of choice
Tools such as Microsoft Power BI are an excellent application example for logistics dashboards. Power BI offers strong connectivity to various data sources (from Excel to complex databases and cloud services such as Azure), enables the creation of highly interactive and appealing visualizations and can be easily shared within the company – even on mobile devices.
Conclusion
In the data-rich world of logistics, transparency is not a luxury, but a necessity for competitiveness and efficiency. Business intelligence dashboards, especially those created with flexible tools like Power BI, are the key to freeing data from silos and transforming it into valuable, actionable insights. They enable logistics managers to understand, control and continuously optimize their complex operations.
Are you facing the challenge of bringing more transparency to your logistics processes? Ailio supports you in the design and implementation of customized BI solutions – from data integration to the finished dashboard. Contact us for a no-obligation consultation!